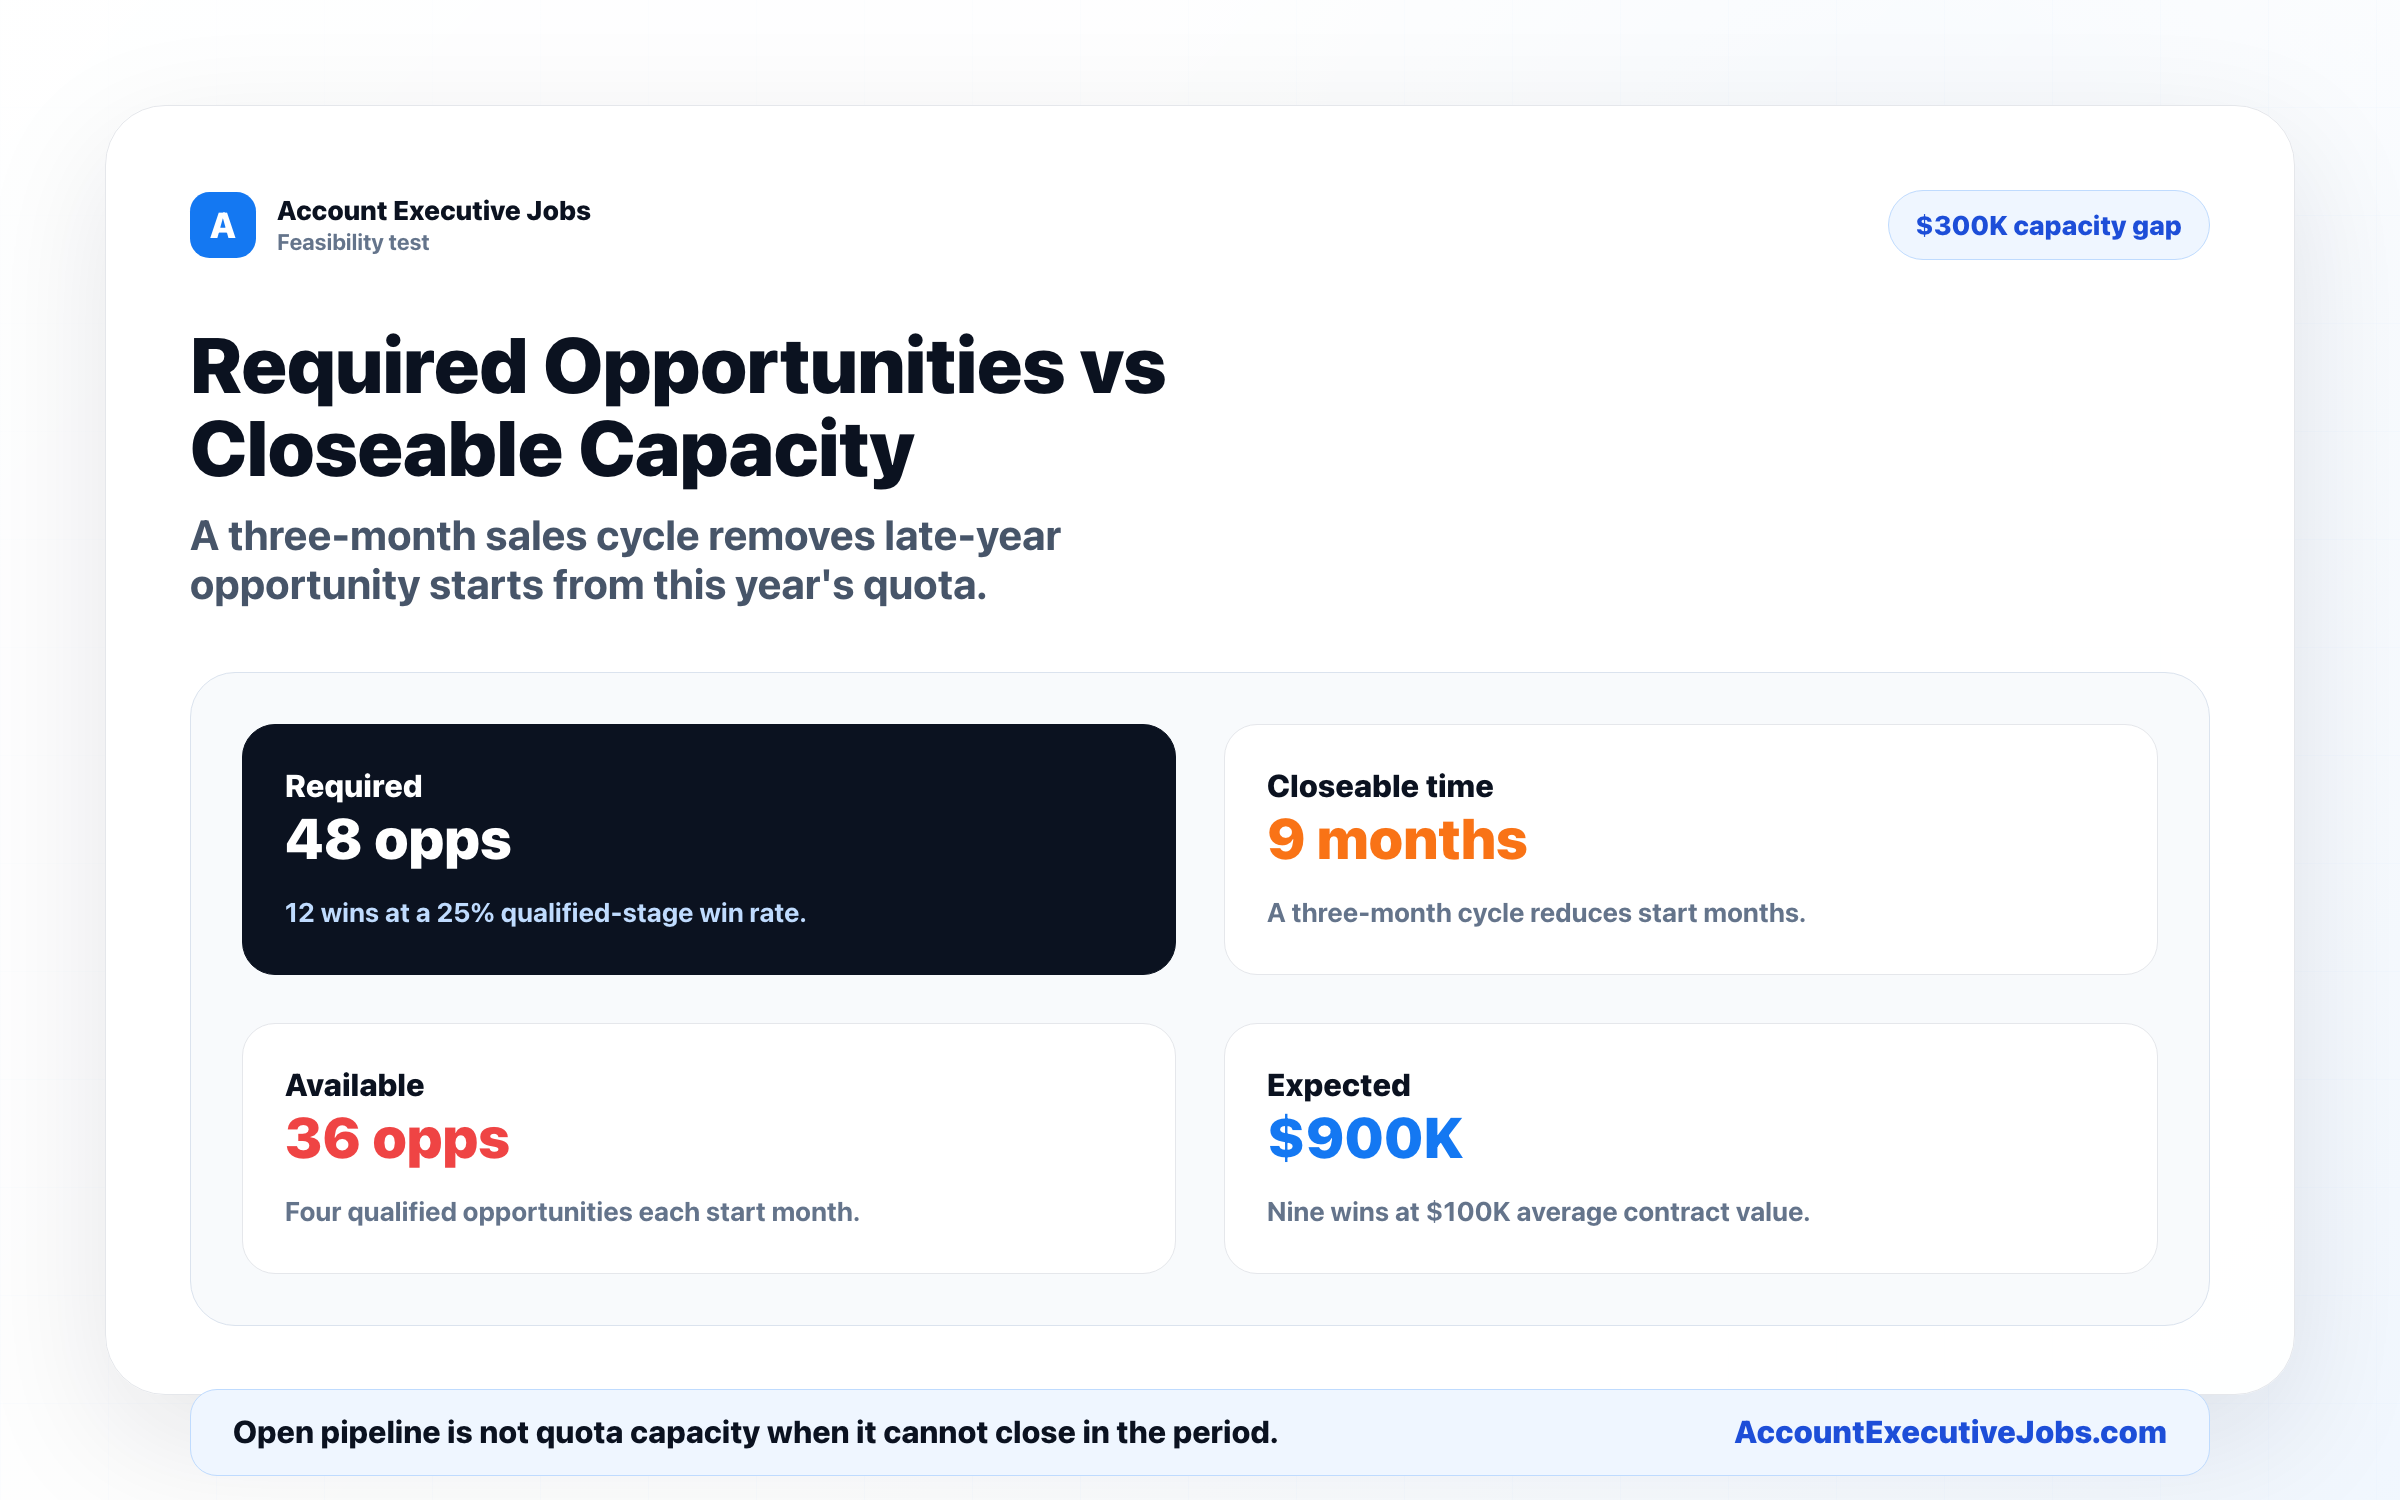
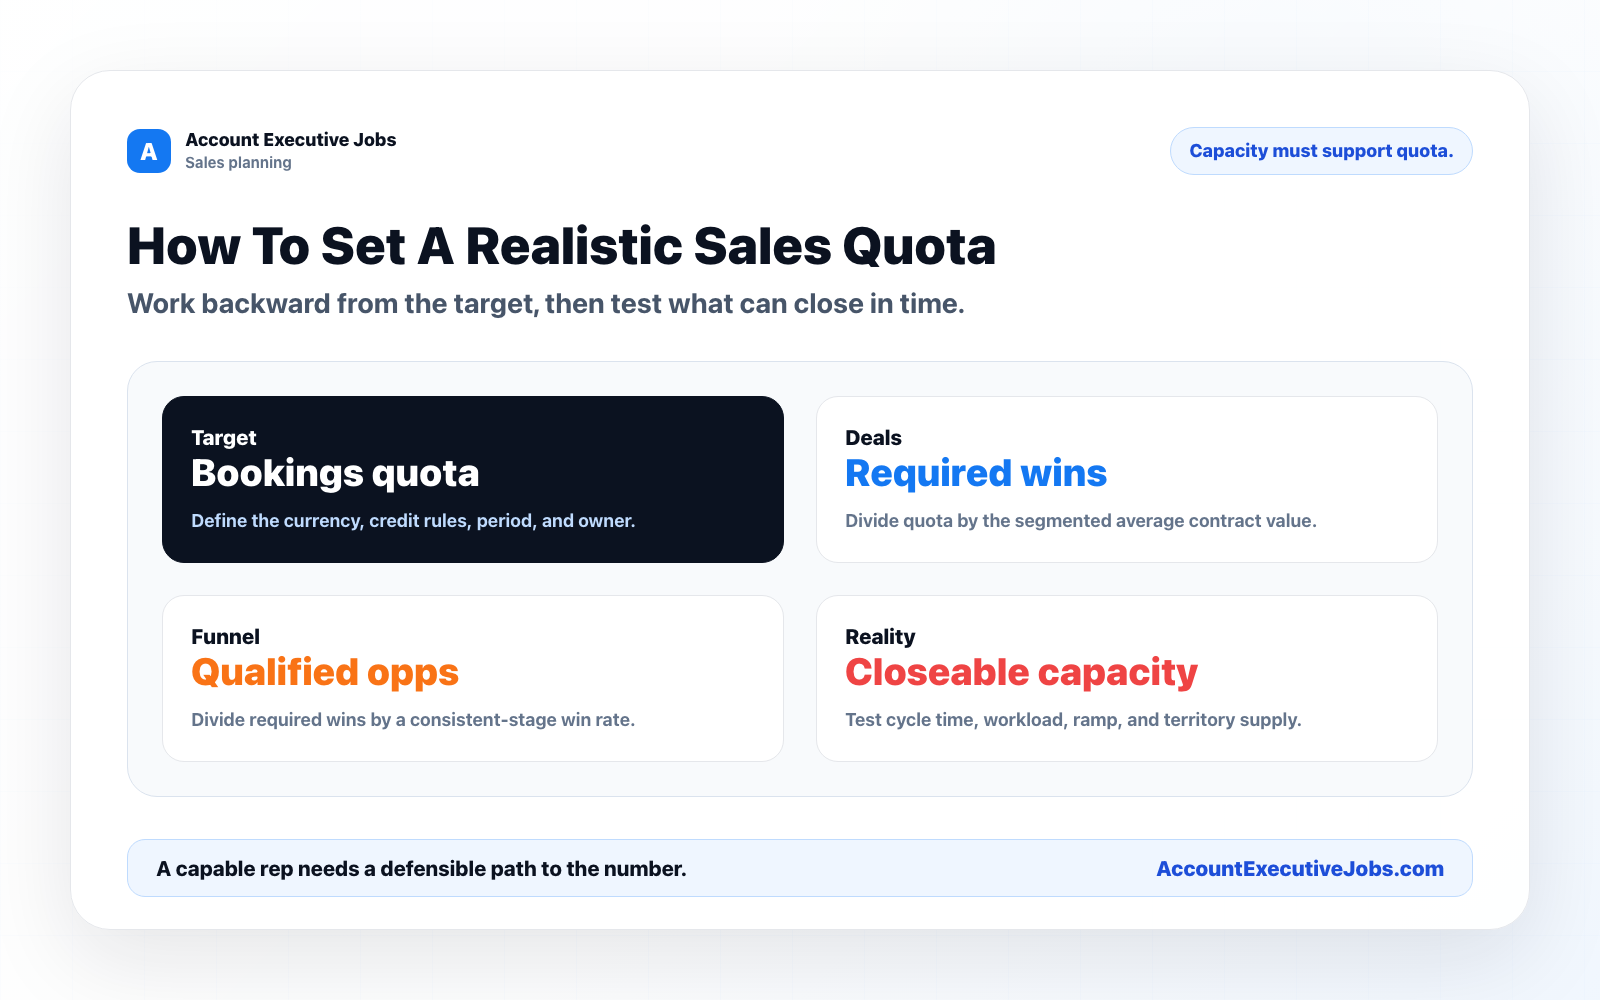
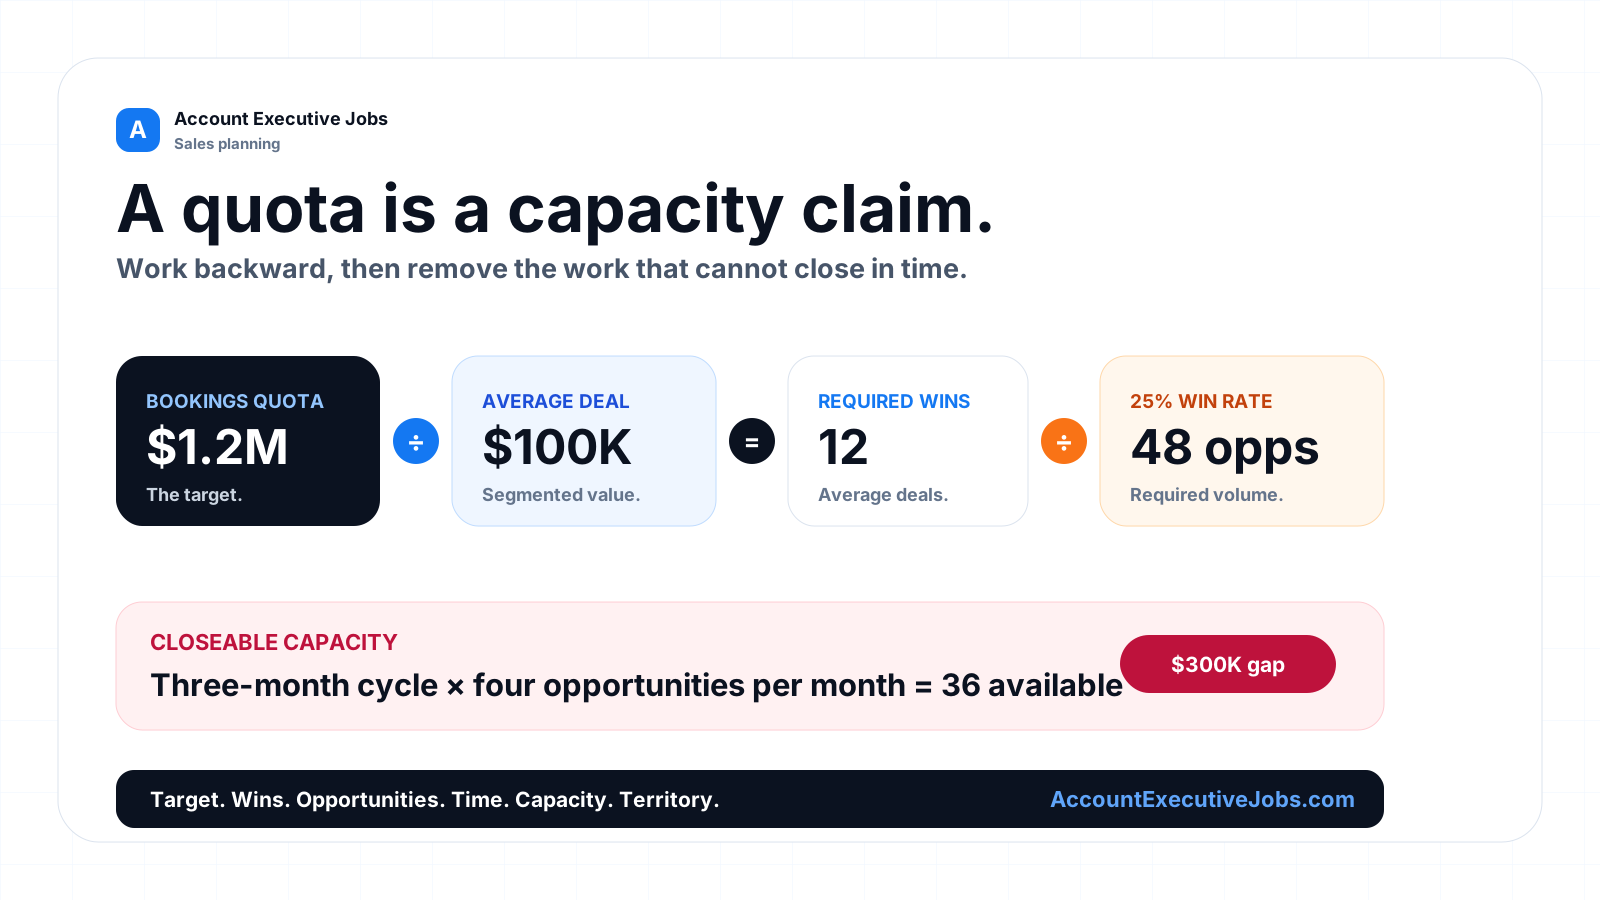
A quota can demand 48 qualified opportunities from a seat that can work and close only 36.
The spreadsheet may still look polished. The hiring plan may still call the target achievable. The math says the rep is short before the year begins.
That is the standard for a realistic sales quota: the target must be supported by enough winnable opportunities, enough selling time, and enough rep capacity to close them inside the quota period.
Use the free Sales Quota Feasibility Calculator while you work through this guide. It uses the same formulas and timing rules as the examples below.
The Short Answer
Set a sales quota by working backward from the revenue target:
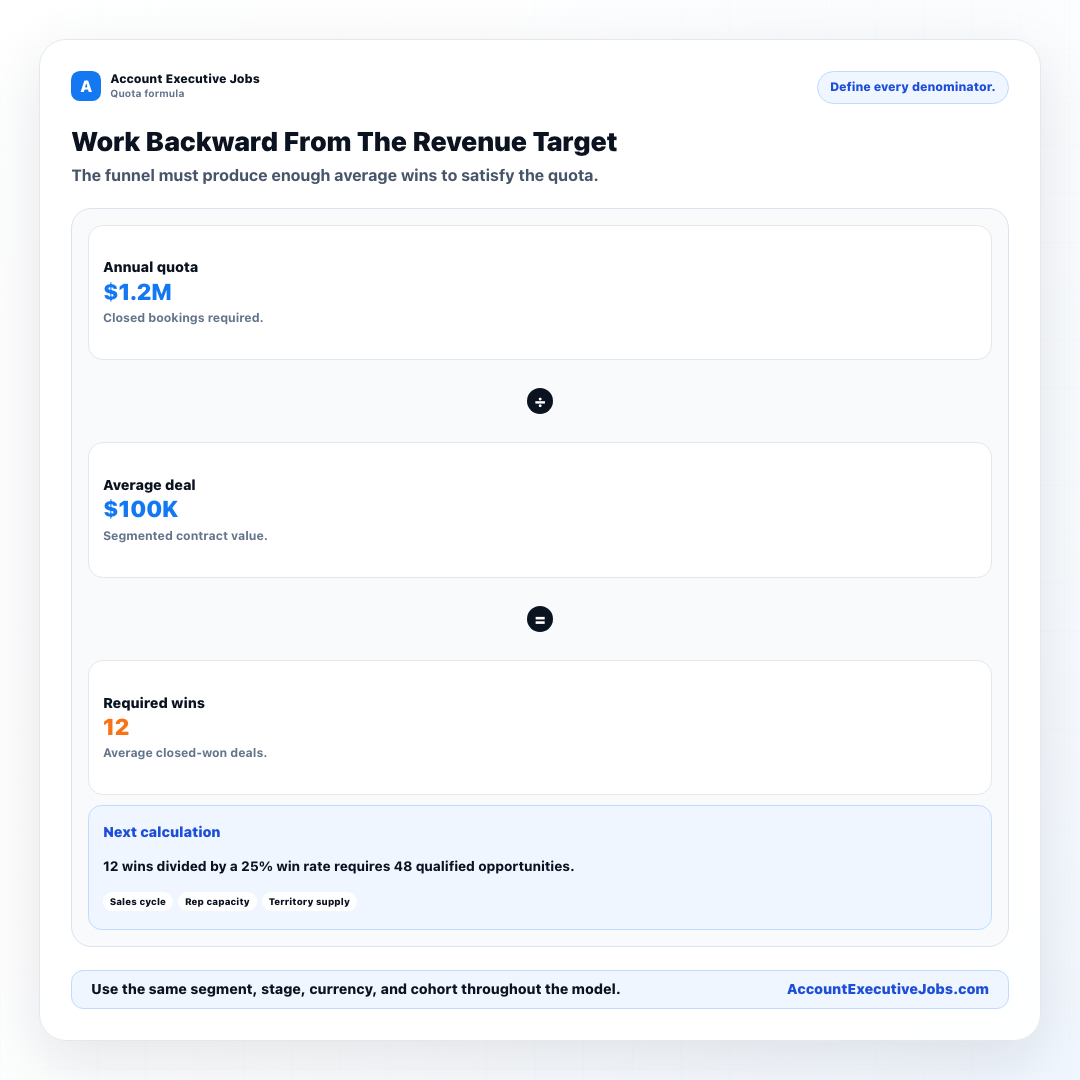
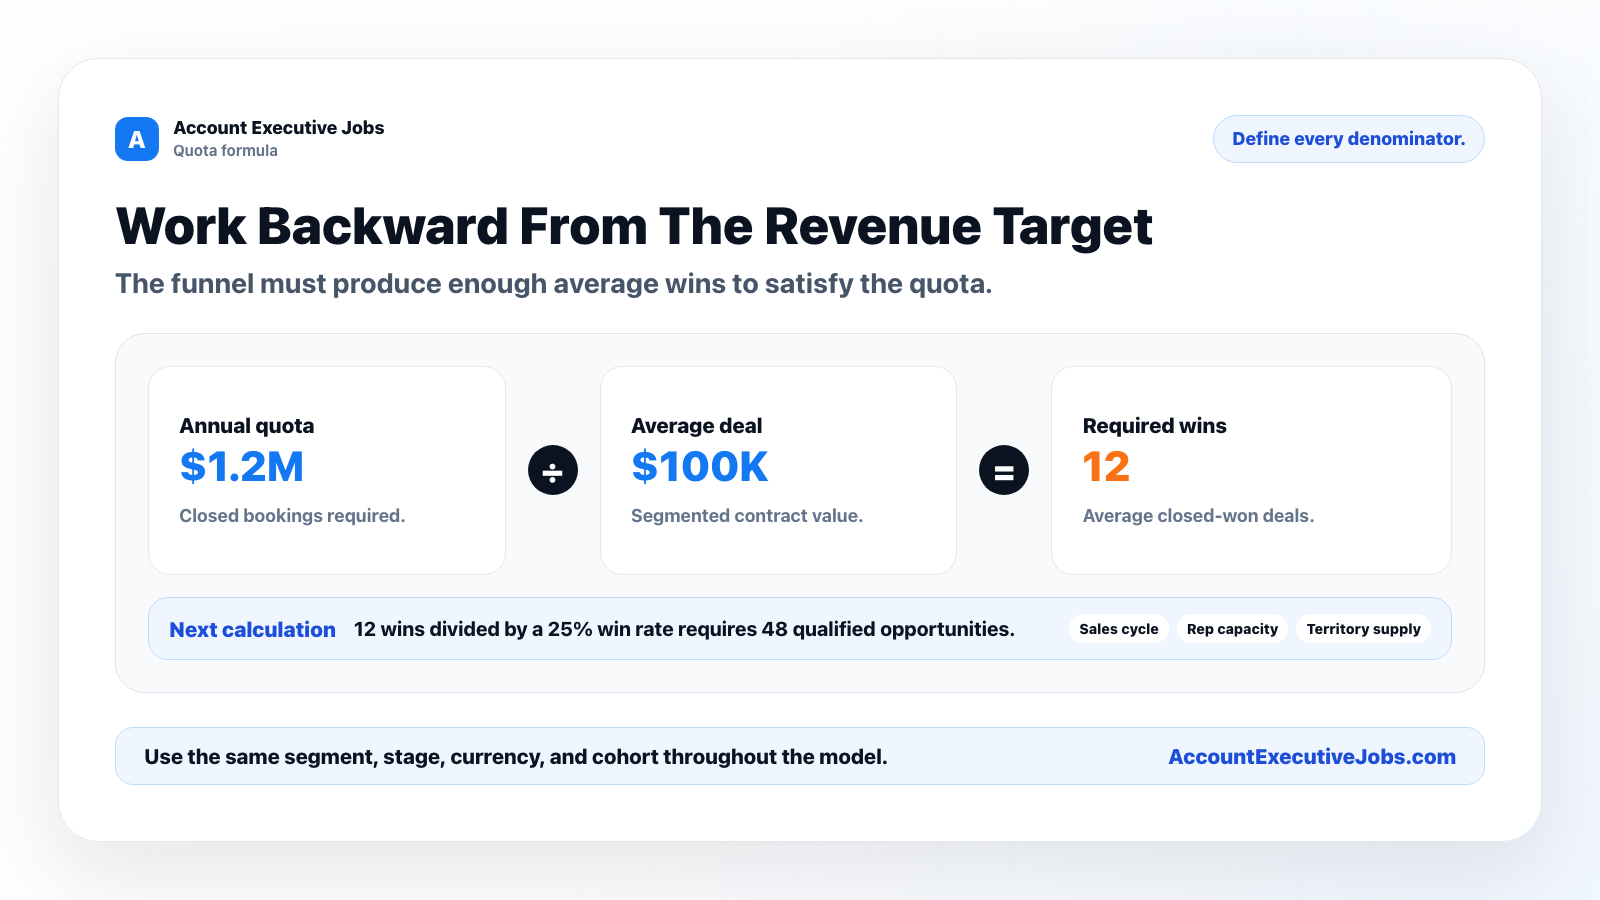
Required wins = bookings quota ÷ average contract value

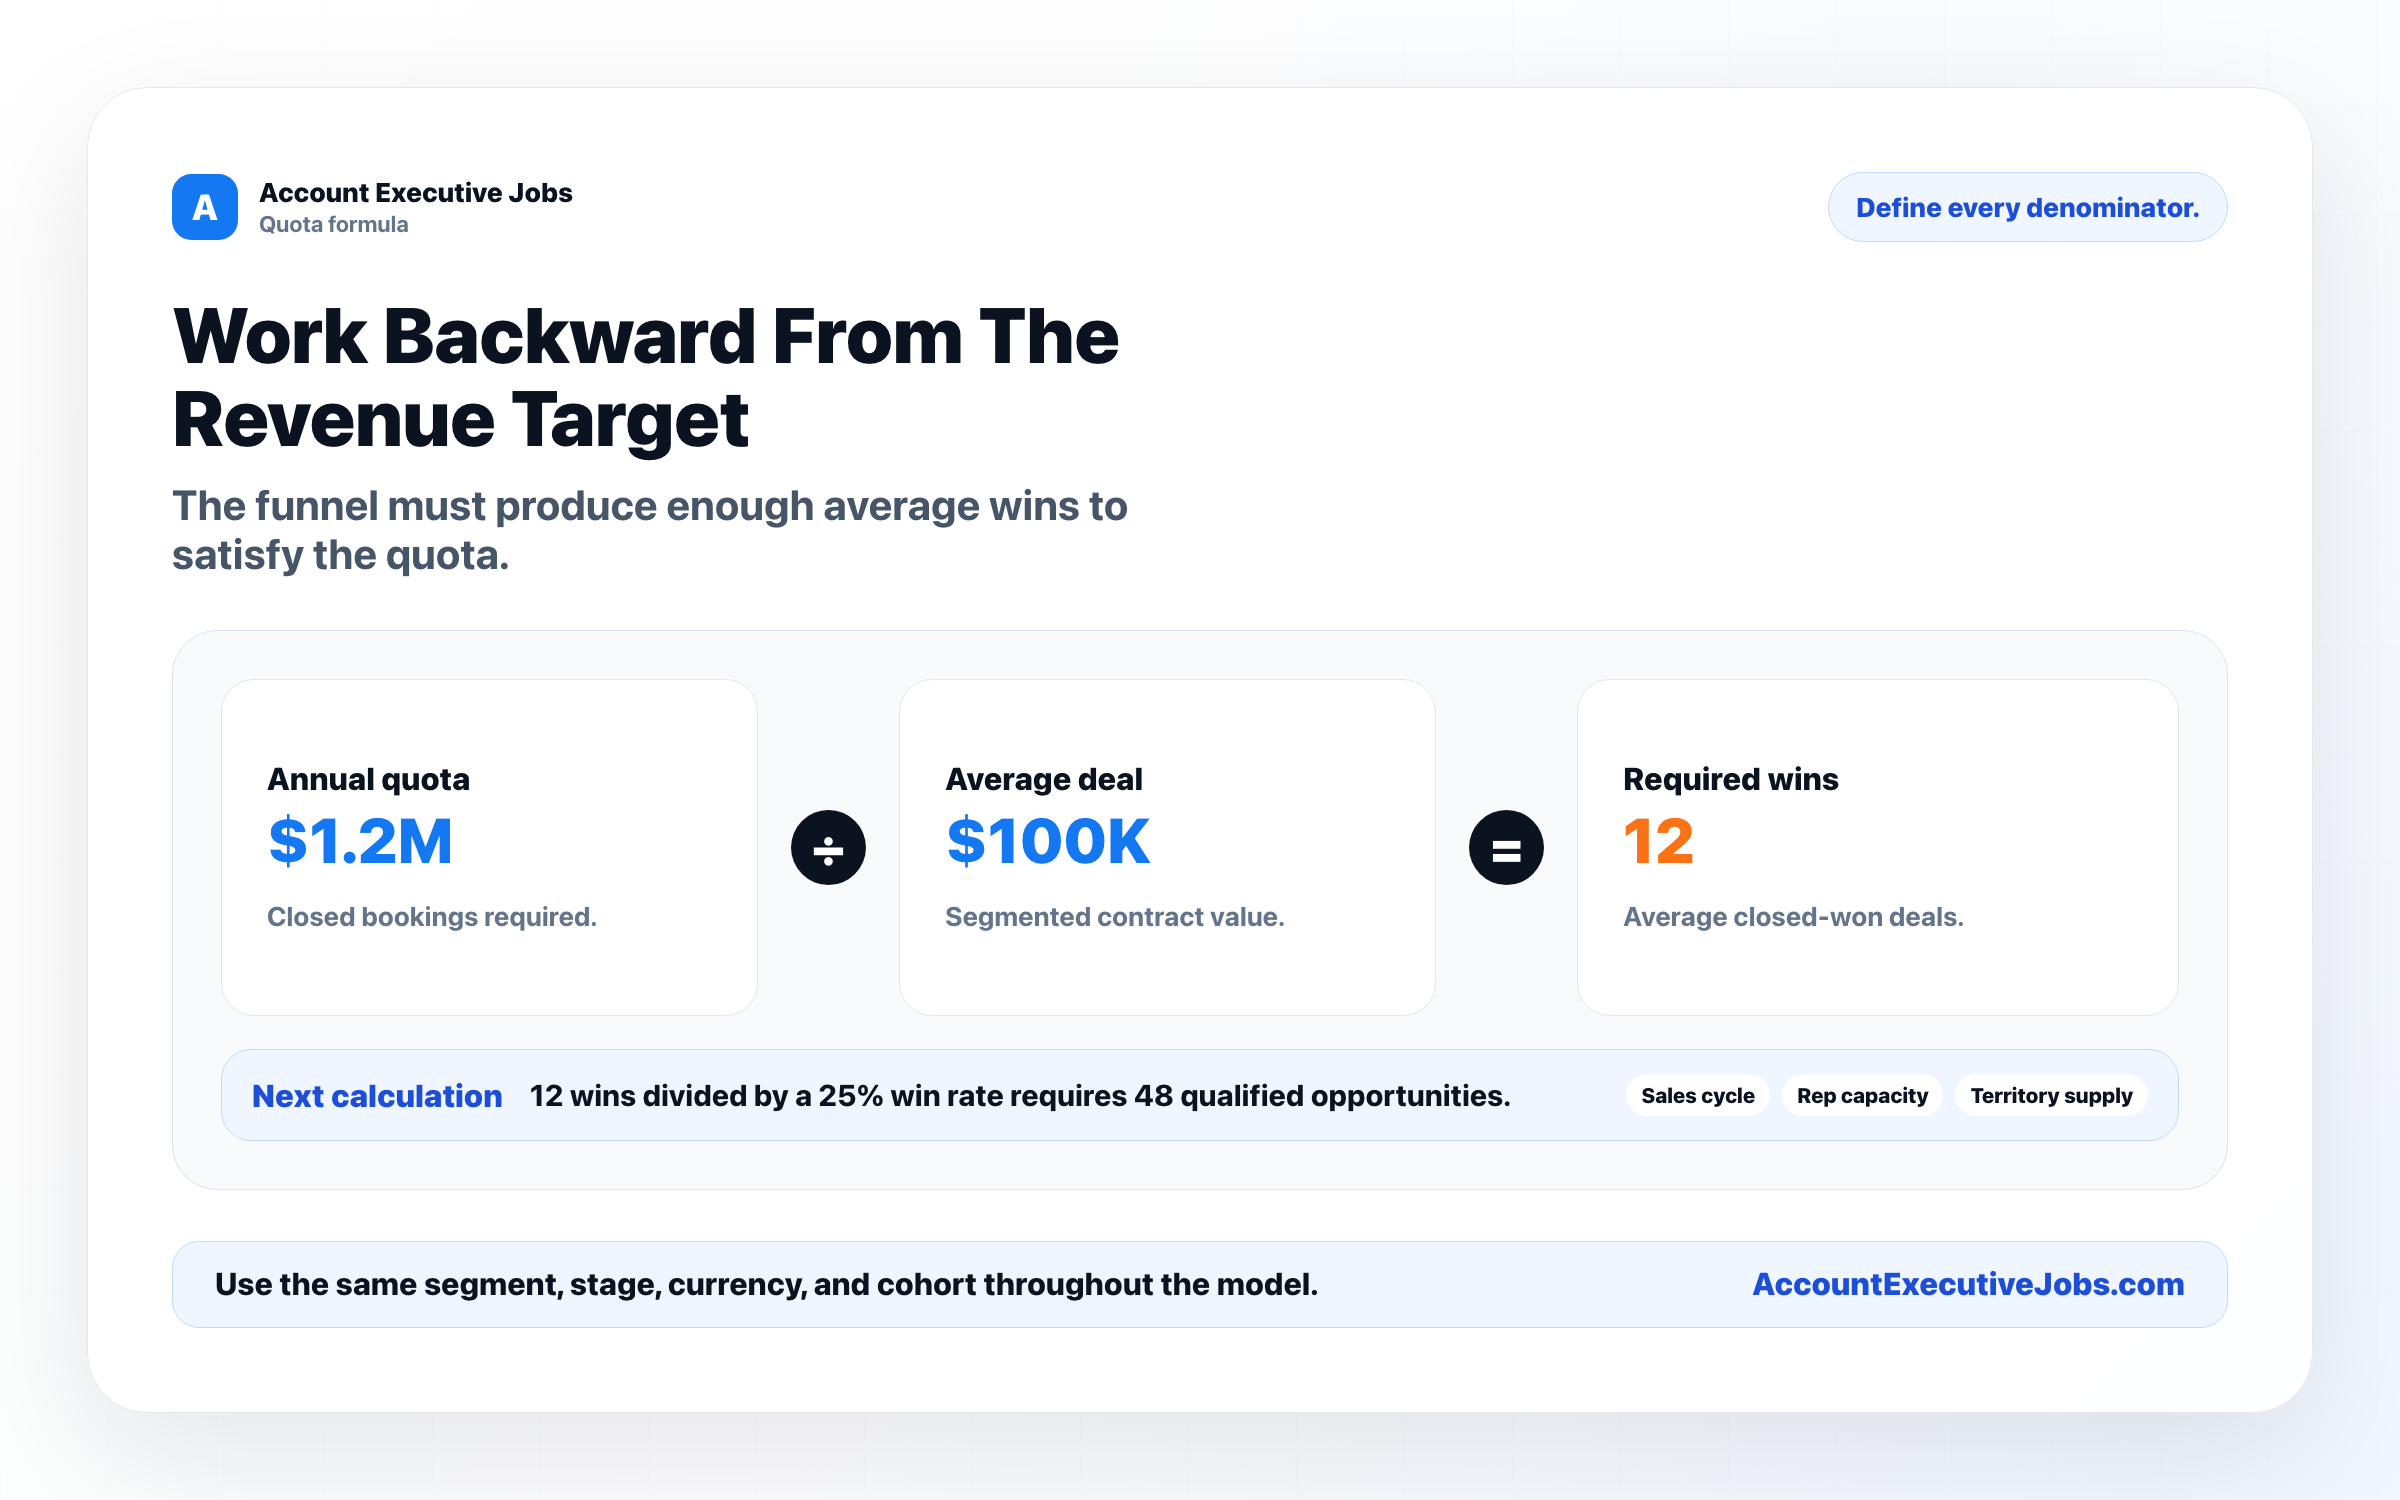
Required qualified opportunities = required wins ÷ qualified-opportunity win rate
Then test whether the territory and rep can supply, work, and close those opportunities before the period ends.
A credible quota model needs at least these inputs:
| Input | What it answers |
|---|---|
| Bookings quota | How much closed business must the rep produce? |
| Average contract value | How many wins does that target require? |
| Qualified-opportunity win rate | How many qualified opportunities must enter the model? |
| Sales-cycle length | Which opportunities can still close in the period? |
| Opportunity workload capacity | How many active qualified opportunities can the rep handle? |
| Ramp schedule | How much capacity exists before the rep is fully productive? |
| Territory opportunity supply | Can the market feed the required volume? |
Do not start with a favorite pipeline-coverage multiple. Start with the operating system of the seat.
Copy embed code
<a href="https://accountexecutivejobs.com/blog/sales-management/how-to-set-a-realistic-sales-quota">
  <img src="https://accountexecutivejobs.com/static-images/blog/how-to-set-a-realistic-sales-quota-funnel-math-motion.svg" alt="Animated sales quota model moving from bookings quota to wins, qualified opportunities, and closeable capacity." width="1600" height="900">
</a>
What Makes A Sales Quota Realistic?
A realistic quota is not merely lower than an aggressive quota. It is a target that survives a documented capacity test.
The model should connect:
- The revenue the company wants.
- The number of wins needed to produce it.
- The number of qualified opportunities needed to produce those wins.
- The time required to close them.
- The rep's capacity to work them.
- The territory's capacity to supply them.
If one link is missing, the quota is an aspiration.
That does not mean every rep will attain. Execution, skill, competition, pricing, product fit, and ordinary variance still matter. It means a capable rep in a viable territory has a defensible path.
Define The Quota Before You Model It
Write down exactly what the quota measures.
Common quota currencies include:
- Booked revenue.
- Annual recurring revenue.
- Gross profit.
- Total contract value.
- Collected cash.
- New logos.
- Units sold.
- A weighted mix of revenue and activity.
Also define the period, crediting rules, and owner.
Is the quota annual with quarterly pacing, or does each quarter stand alone? Does a three-year contract count at full contract value or first-year value? Is credit split with a sales engineer, channel partner, or overlay rep? Do renewals count? Do services count?
Two managers can both say "$1.2 million quota" while describing different jobs.
The quota definition must match the historical data used in the model. If the target uses annual recurring revenue but the average deal value uses total contract value, the result is not conservative or aggressive. It is invalid.
Use Segmented Inputs, Not Company-Wide Averages
An enterprise AE selling a new product into named accounts does not share a useful average with a commercial AE handling inbound demand.
Segment the source data by the factors that materially change the motion:
- Market segment.
- Geography.
- New logo versus expansion.
- Inbound, outbound, partner, or product-led source.
- Product family.
- Deal-size band.
- New territory versus mature territory.
- Rep tenure.
Salesforce defines win rate, average selling price, quota attainment, pipeline coverage, and sales cycle as separate measures. Keep them separate in the model too.
If the data set is thin, show the uncertainty. Use a base case, a downside case, and an upside case. Do not hide a weak sample behind a precise percentage.
Step 1: Convert Quota Into Required Wins
Suppose an AE has:
- $1.2 million annual bookings quota.
- $100,000 average contract value.
The rep needs 12 average-sized wins.
$1,200,000 ÷ $100,000 = 12 winsAverage contract value is a planning input, not a promise. A few small deals can push the required win count up. One large deal can pull it down. If the distribution is wide, model deal bands instead of relying on one mean.
For example:
- 6 small wins at $50,000.
- 4 mid-market wins at $100,000.
- 2 large wins at $250,000.
That portfolio also produces $1.2 million, but it requires a different pipeline, cycle, and selling motion than 12 identical $100,000 wins.
Step 2: Convert Required Wins Into Qualified Opportunities
Now apply the win rate from a consistent qualified stage.
If the qualified-opportunity win rate is 25%:
12 wins ÷ 25% = 48 qualified opportunitiesThe word qualified matters.
Do not use all created leads in the denominator if the historical win rate starts at sales-qualified opportunity. Do not use proposal-stage win rate if the quota model assumes opportunities from discovery. Match the stage definition, segment, and cohort.
This is where many quota plans quietly inflate themselves. They take a strong late-stage win rate and apply it to a much larger early-stage opportunity count.
Copy embed code
<a href="https://accountexecutivejobs.com/blog/sales-management/how-to-set-a-realistic-sales-quota">
  <img src="https://accountexecutivejobs.com/static-images/blog/how-to-set-a-realistic-sales-quota-quota-backward-math-inline.png" alt="Sales quota formulas for converting a bookings target into required wins and qualified opportunities." width="1600" height="900">
</a>
Step 3: Remove Opportunities That Cannot Close In Time
A 90-day sales cycle changes an annual quota model.
An opportunity that begins in November is useful pipeline, but it is unlikely to close inside the same calendar year if the normal cycle is three months.
For a simple annual model:
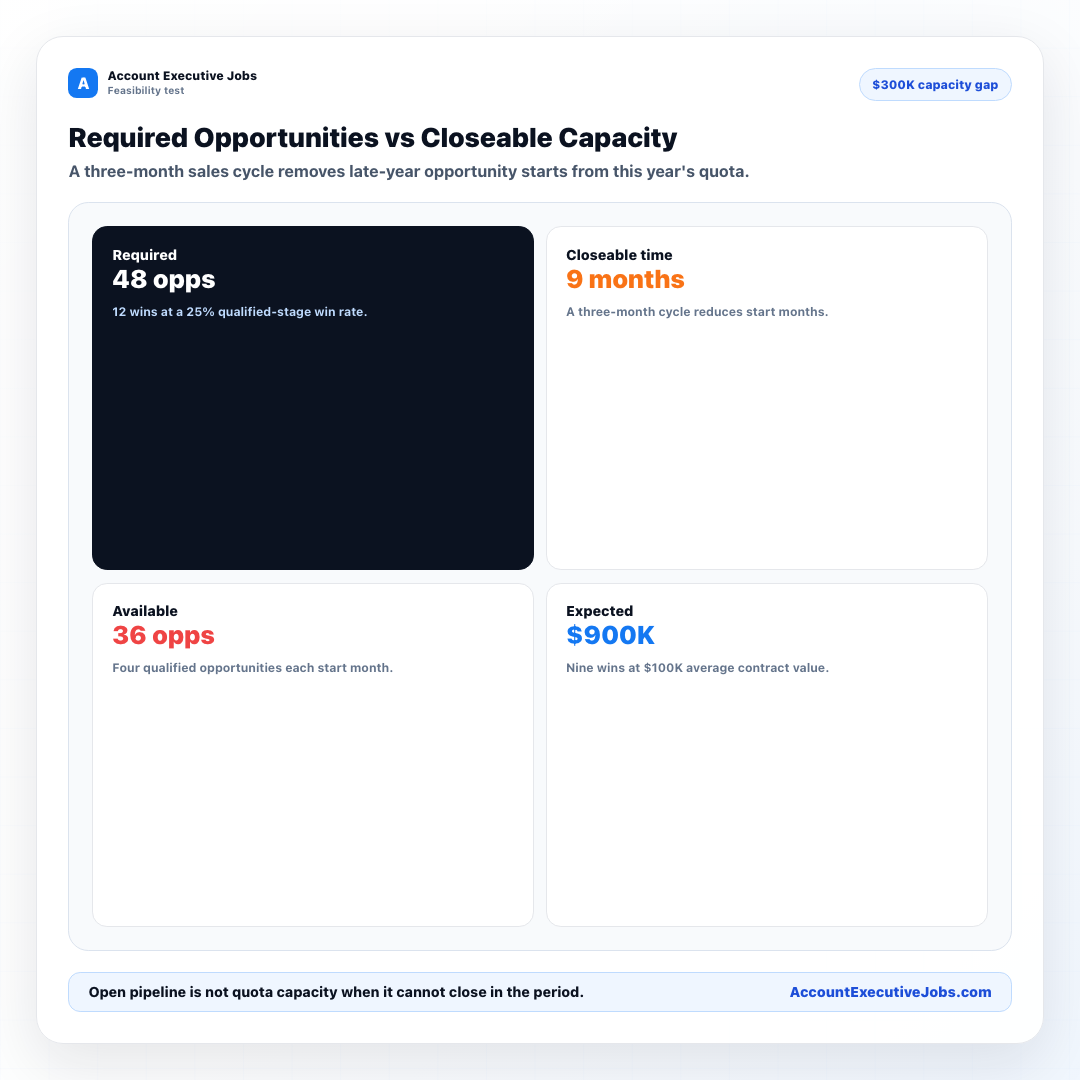
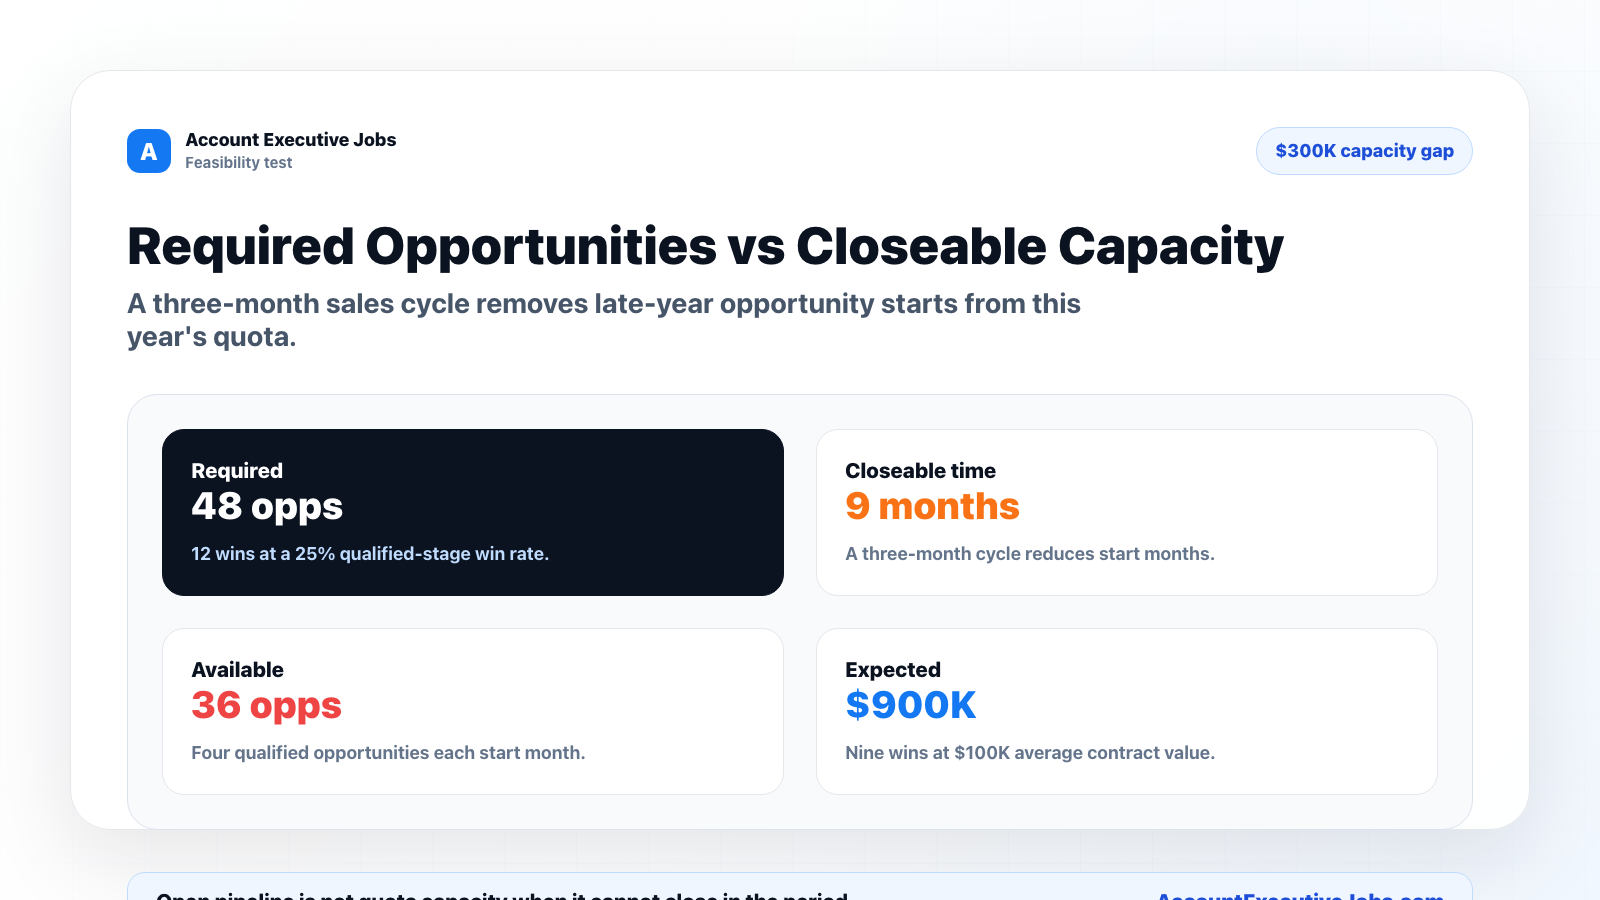
Closeable start months = quota-period months - sales-cycle monthsWith a 12-month year and a three-month cycle, the model has nine closeable start months.
That timing rule is intentionally simple. Real pipelines have a distribution, not one exact cycle length. A better model uses cohort data by segment and stage. The simple rule is still better than pretending December-created pipeline can satisfy a December quota.
Carryover pipeline can restore capacity at the beginning of the year. If you include it, separate real, stage-verified carryover from unqualified open records.
Step 4: Test The Rep's Opportunity Capacity
The AE also needs enough working capacity.
Suppose the rep can properly work four new qualified opportunities per month. With nine closeable start months:
4 opportunities × 9 months = 36 closeable qualified opportunitiesAt a 25% win rate and $100,000 average contract value:
36 opportunities × 25% × $100,000 = $900,000 expected bookingsThe quota requires $1.2 million. The tested capacity supports $900,000.
That is a $300,000 design gap.
Copy embed code
<a href="https://accountexecutivejobs.com/blog/sales-management/how-to-set-a-realistic-sales-quota">
  <img src="https://accountexecutivejobs.com/static-images/blog/how-to-set-a-realistic-sales-quota-closeable-capacity-inline.png" alt="Example comparing 48 required qualified opportunities with capacity for 36 opportunities that can close inside the quota year." width="1600" height="900">
</a>
Workload capacity is not the same as opportunity supply.
The market may contain 200 plausible accounts while the rep can actively manage only 20 qualified opportunities at once. Or the rep may have time for 48 opportunities while the territory generates only 30.
Model both constraints:
Usable opportunity capacity =
the lower of territory supply and rep workload capacity
Step 5: Add Ramp Instead Of Averaging It Away
A new AE does not produce at full capacity on day one.
Build a monthly ramp curve that reflects the motion. A simple five-month example might use:
| Month | Productive-capacity factor |
|---|---|
| 1 | 0% |
| 2 | 30% |
| 3 | 60% |
| 4 | 90% |
| 5 onward | 100% |
The right curve depends on product complexity, cycle length, territory inheritance, enablement, lead flow, and prior category knowledge.
A ramp guarantee can protect the rep's pay. It does not create closed revenue. Keep pay ramp and productive capacity as separate lines.
Use the Sales Ramp Plan Builder to model monthly productive capacity alongside the quota model.
Four Ways To Repair An Impossible Quota
The $1.2 million example needs 48 qualified opportunities but supports only 36. There are four clean levers.
Lower The Quota
At the tested capacity, the expected bookings level is $900,000.
36 opportunities × 25% × $100,000 = $900,000Increase Qualified Opportunity Capacity
To create 48 closeable opportunities across nine start months:
48 ÷ 9 = 5.33 qualified opportunities per monthThat increase must come with enough rep capacity and territory supply. Adding meetings without protecting qualification quality will usually lower the win rate.
Improve Win Rate
To produce 12 wins from 36 opportunities:
12 ÷ 36 = 33.33% win rateMoving from 25% to 33.33% is meaningful. Name the operational reason it should happen: tighter qualification, stronger product fit, better pricing, better enablement, or a changed segment.
Increase Average Contract Value
To produce $1.2 million from nine expected wins:
$1,200,000 ÷ 9 = $133,333 average contract valueAgain, name the mechanism. A price increase, packaging change, enterprise shift, or expansion motion may support it. Hope does not.
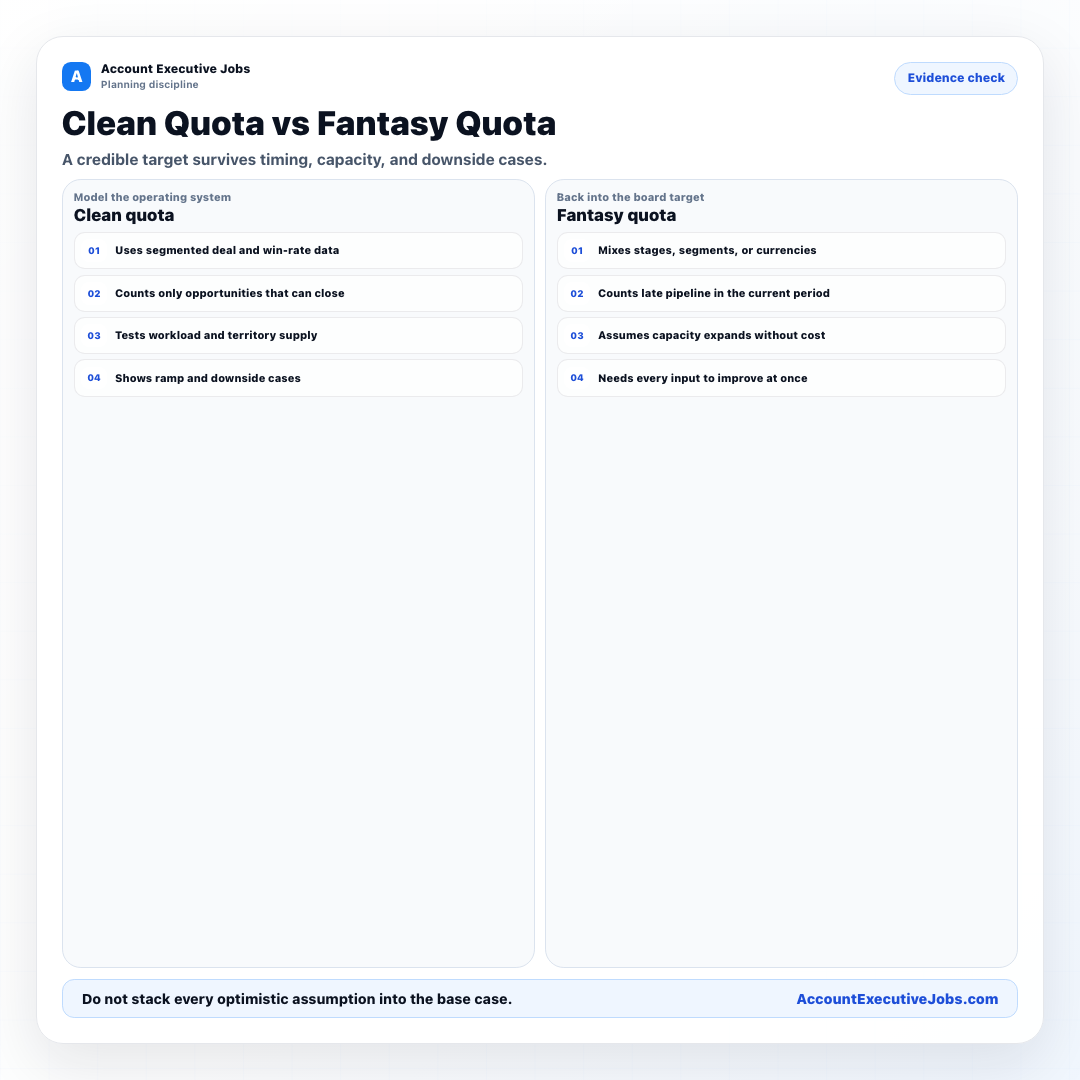
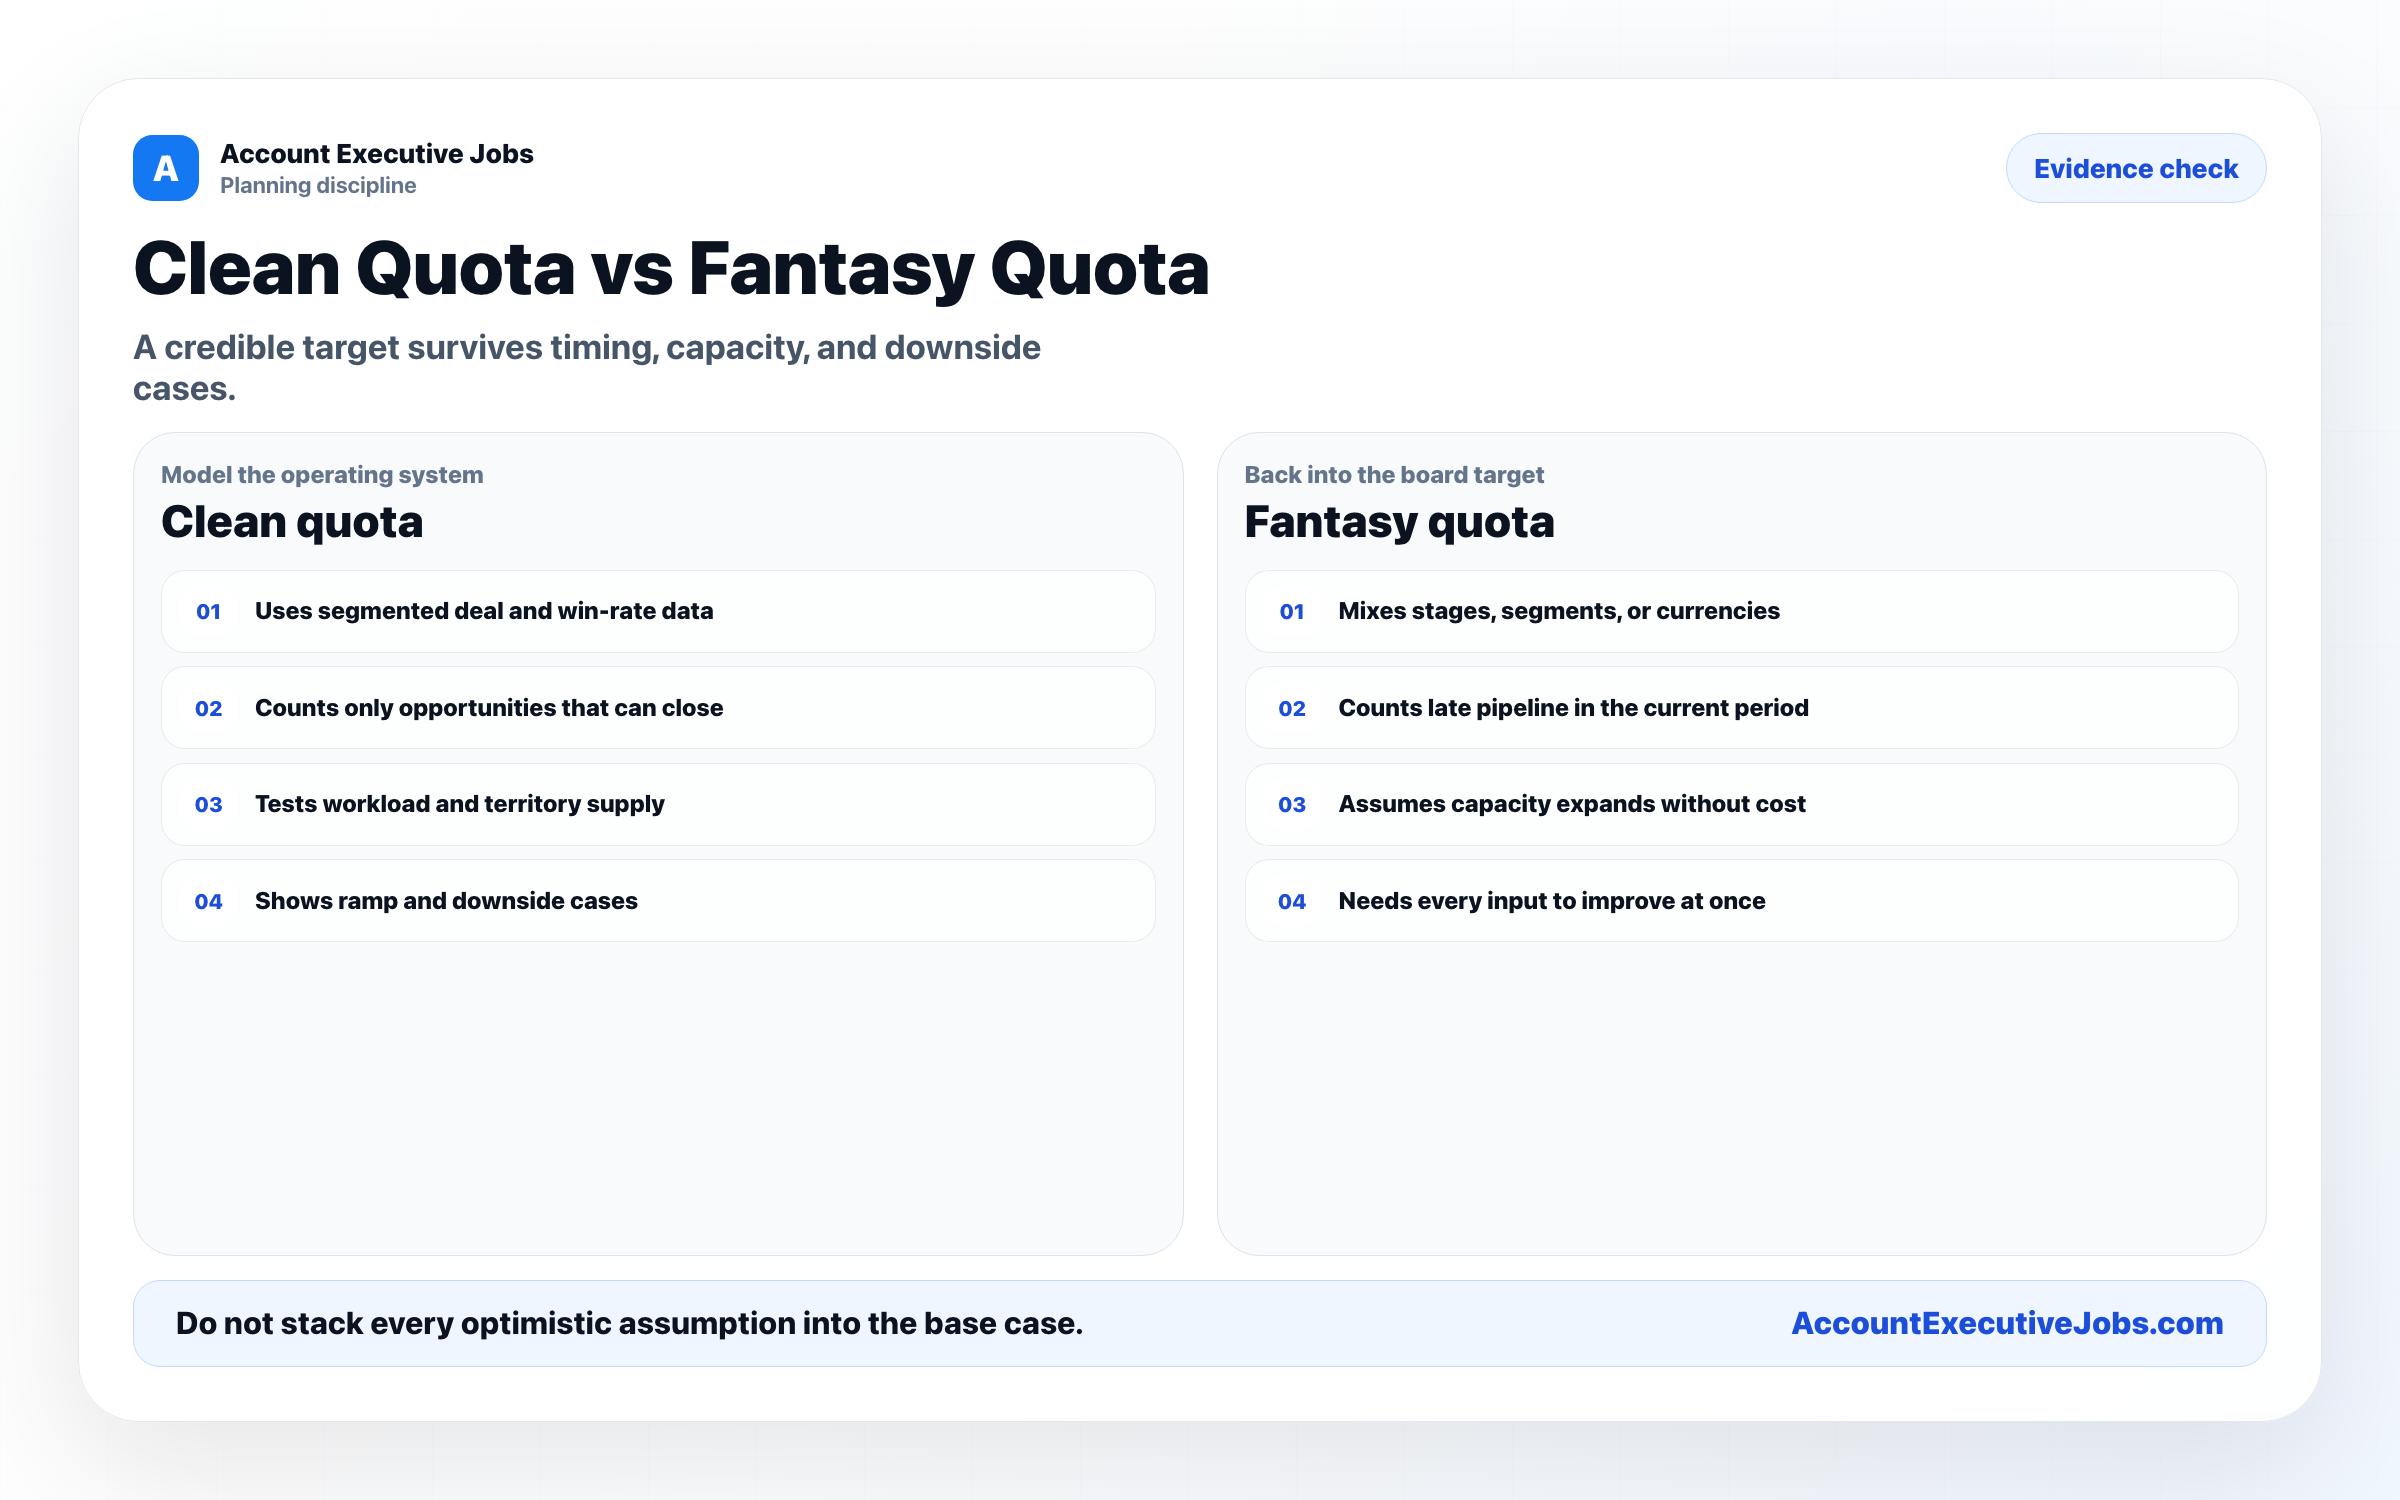
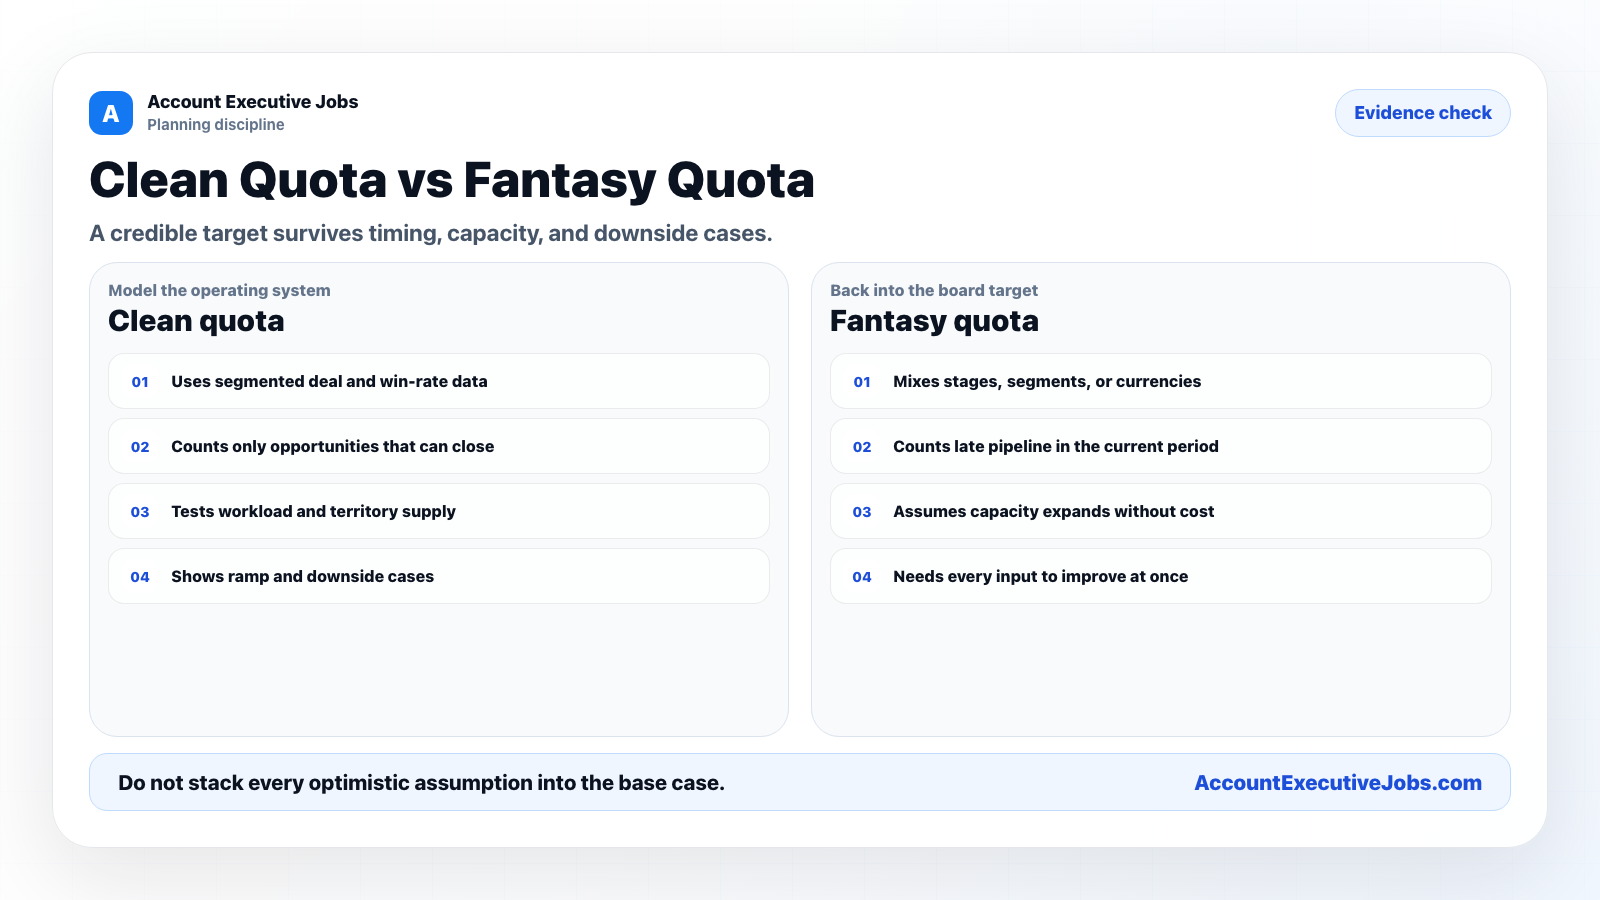
Do not stack all four optimistic changes in one base case. If the quota requires more opportunities, a higher win rate, larger deals, and a shorter cycle at the same time, the model is describing a transformation project.
Pipeline Coverage Is A Diagnostic, Not A Quota Formula
Pipeline coverage is often expressed as:
Open pipeline ÷ remaining quotaIt can be useful. It is not a universal answer.
A 3x ratio might be more than enough for a motion with a high qualified-stage win rate. It may be far too low for a motion with weak qualification, long cycles, concentrated deals, or stale pipeline.
Coverage also ignores workload. A rep can show impressive nominal pipeline while carrying too many opportunities to run a good process.
Derive the required coverage from your stage-specific conversion rates and timing. Then watch how it changes by segment.
Quota-To-OTE Does Not Prove Feasibility
Quota divided by on-target earnings is an economic ratio:
Quota-to-OTE = annual quota ÷ annual OTEIf quota is $1.2 million and OTE is $240,000, the ratio is 5x.
That can help a company examine sales economics. It does not prove the territory can produce $1.2 million. A clean compensation ratio can sit on top of an impossible funnel.
Candidates should examine both the pay model and the operating model. Our guide to account executive salary, OTE, quota, and pay risk covers the compensation side.
Account For Territory, Seasonality, And Concentration
Funnel math is strongest when it is attached to a territory plan.
Ask:
- How many qualified accounts exist?
- How many are already customers?
- Which accounts are assigned elsewhere?
- How many have bought in the past?
- How much pipeline carries into the year?
- Which months produce and close the most business?
- How concentrated are results in a few large deals?
- How often do territories change?
An average quota can still be unfair if territory capacity varies sharply.
Large-deal concentration also widens the range of outcomes. If one $400,000 deal represents a third of quota, a simple expected-value model needs a scenario that shows what happens when that deal slips.
Build A Base Case And A Downside Case
One forecast is not a decision model.
At minimum, test:
| Case | ACV | Win rate | Cycle | Opportunity capacity |
|---|---|---|---|---|
| Downside | Lower | Lower | Longer | Lower |
| Base | Segmented historical input | Segmented historical input | Normal cohort | Normal capacity |
| Upside | Higher, with a reason | Higher, with a reason | Shorter, with a reason | Higher, with a reason |
The base case should not require every assumption to improve.
The downside case tells finance how much risk sits in the plan. It also tells sales leadership where to intervene first.
Copy embed code
<a href="https://accountexecutivejobs.com/blog/sales-management/how-to-set-a-realistic-sales-quota">
  <img src="https://accountexecutivejobs.com/static-images/blog/how-to-set-a-realistic-sales-quota-clean-vs-fantasy-quota-inline.png" alt="Comparison between a realistic sales quota built from segmented evidence and a fantasy quota built from optimistic assumptions." width="1600" height="900">
</a>
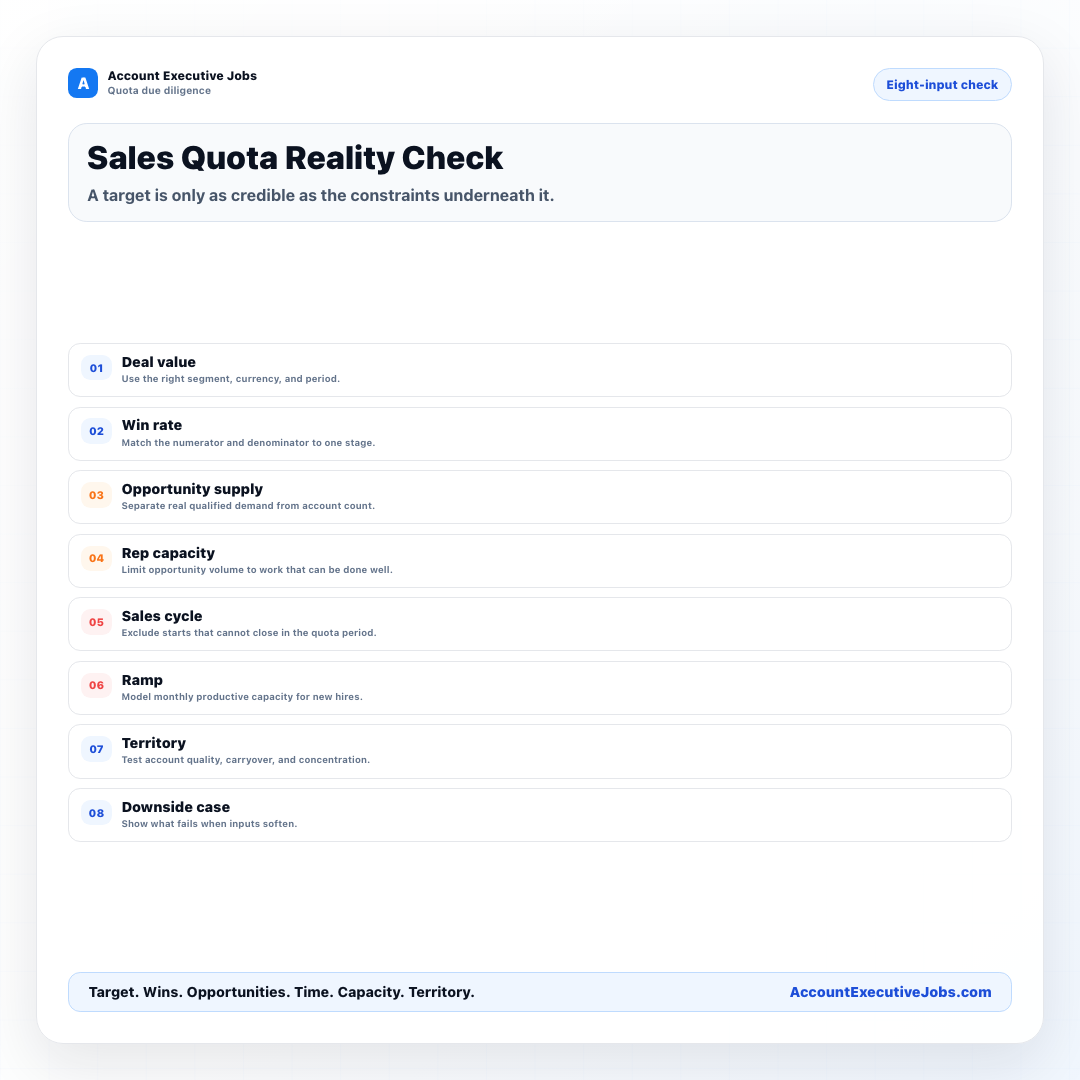
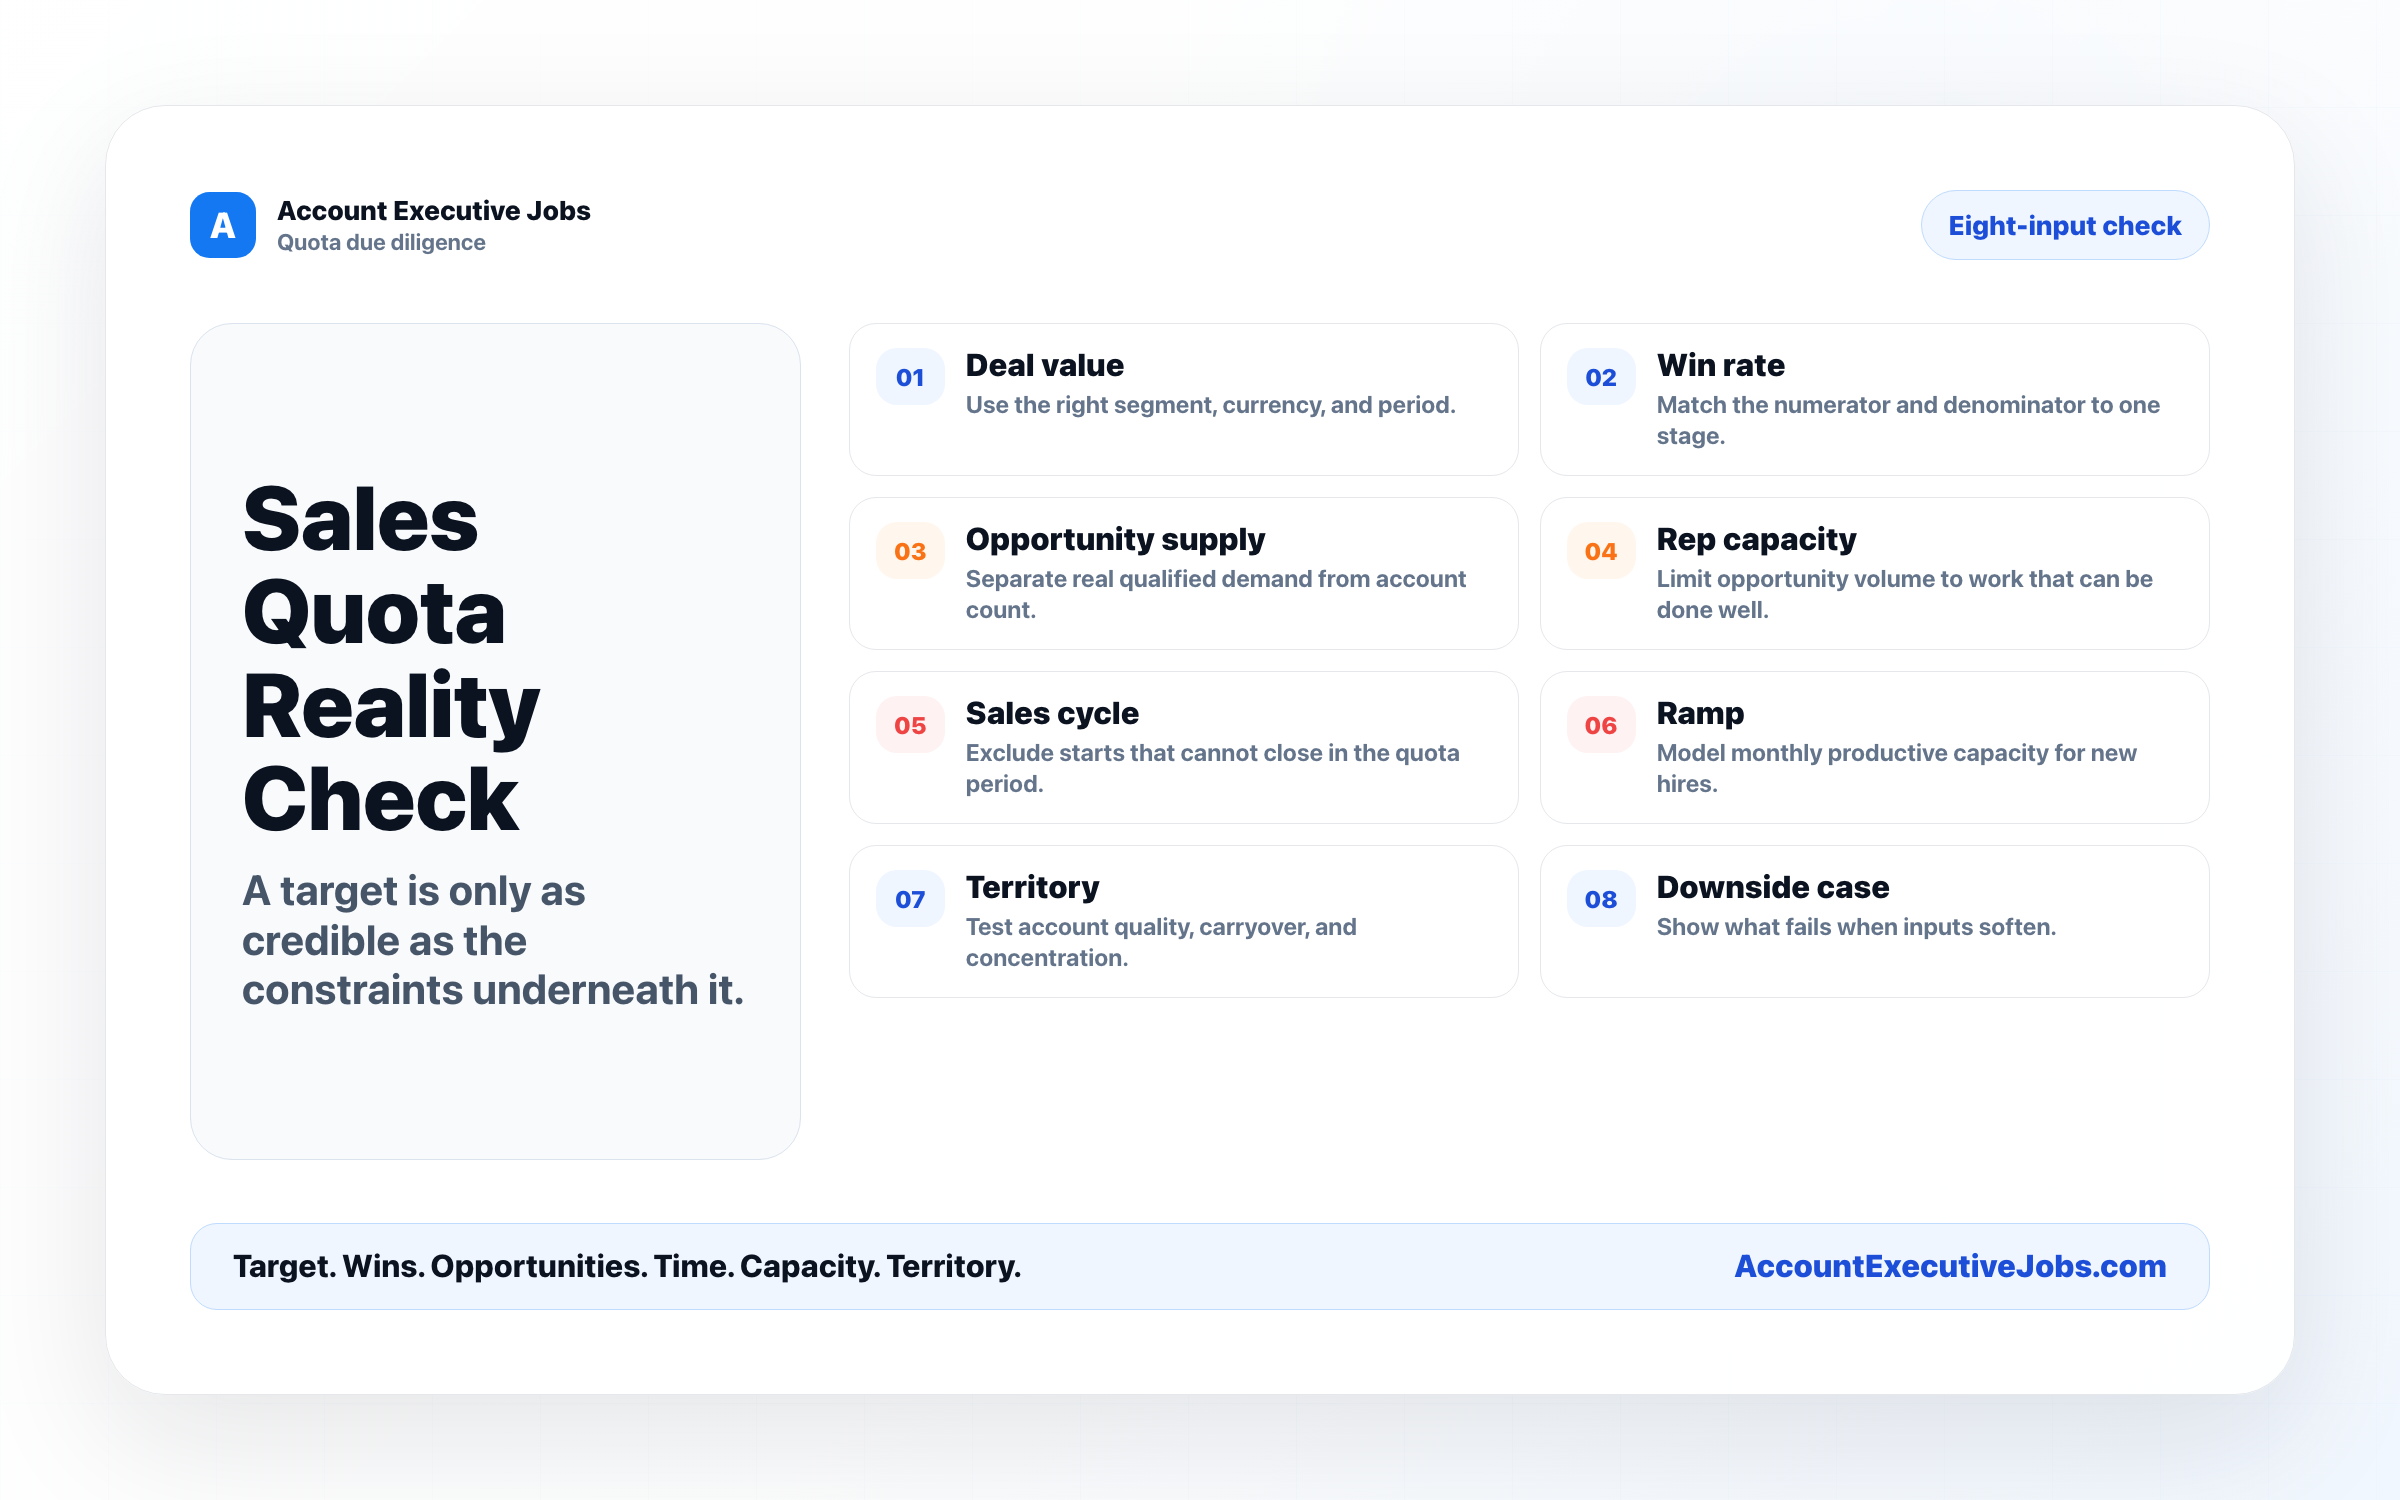
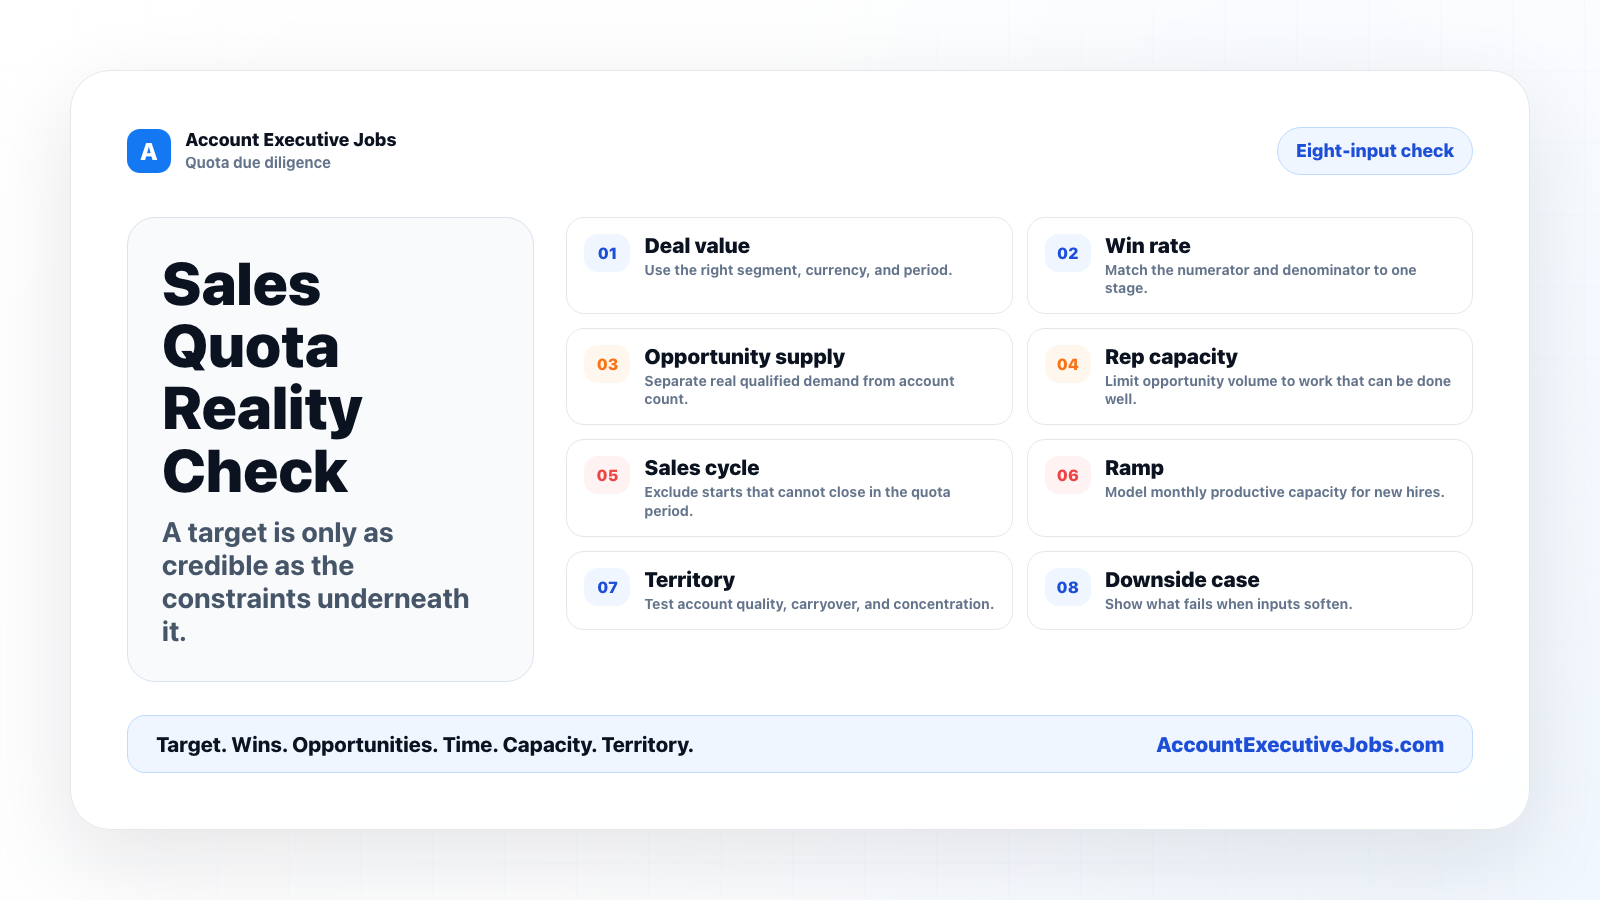
Questions A Sales Leader Should Answer Before Publishing Quota
- What exactly receives quota credit?
- What historical cohort supports the average contract value?
- At which stage is win rate measured?
- How many qualified opportunities must the rep work?
- Can those opportunities close inside the period?
- Does the territory contain enough qualified accounts?
- What ramp curve applies to a new hire?
- How much carryover pipeline is real?
- Which assumption causes the model to fail first?
- What happens to quota when territory, segment, or product scope changes?
If the answers are not documented, the plan is not finished.
Copy embed code
<a href="https://accountexecutivejobs.com/blog/sales-management/how-to-set-a-realistic-sales-quota">
  <img src="https://accountexecutivejobs.com/static-images/blog/how-to-set-a-realistic-sales-quota-quota-reality-check-inline.png" alt="Sales quota reality check covering deal value, win rate, opportunity supply, capacity, sales cycle, ramp, territory, and downside cases." width="1600" height="900">
</a>
Questions A Candidate Should Ask About Quota
Candidates rarely receive enough operating data to rebuild the full model. You can still ask for the evidence behind it:
- What percentage of fully ramped reps hit quota last year?
- What was the median attainment for fully ramped reps?
- How many qualified opportunities does a typical rep receive or create each month?
- What stage does the company call qualified?
- What are the median deal size, win rate, and sales cycle for this segment?
- How much pipeline will I inherit?
- How long is ramp, and how does quota change during it?
- How often did territories or quotas change last year?
- Why is this territory open?
The quality of the answer matters as much as the number. Specific definitions and cohort dates are evidence. "Top reps crush it" is not.
Common Sales Quota Planning Mistakes
Starting With The Revenue Plan
The board target may be real. It does not automatically become seller capacity when divided by headcount.
Using A Late-Stage Win Rate
A proposal-stage win rate cannot be applied to discovery-stage opportunity volume.
Ignoring Sales-Cycle Timing
Pipeline created too late to close can support next period, not the current quota.
Treating Every Rep As Fully Ramped
Hiring dates and ramp curves change annual capacity.
Confusing Account Count With Opportunity Supply
A named account is not a qualified opportunity.
Assuming More Pipeline Has No Cost
Opportunity volume can overwhelm discovery, follow-up, multithreading, and deal strategy.
Using One Average Across Different Motions
Enterprise, commercial, inbound, outbound, new logo, and expansion motions need separate inputs.
Frequently Asked Questions
What Is A Good Sales Quota?
A good sales quota is economically useful to the company and feasible for a capable, fully supported rep in the assigned territory. It should be supported by segmented deal value, win rate, opportunity supply, workload capacity, sales-cycle timing, and ramp assumptions.
What Is The Formula For A Sales Quota?
There is no single quota-setting formula, but the core backward model is:
Required wins = quota ÷ average contract value
Required qualified opportunities = required wins ÷ win rate
The result must then pass timing, capacity, ramp, and territory tests.
How Much Pipeline Coverage Does A Rep Need?
Derive coverage from the win rate and stage definition used by that sales motion. A universal 3x, 4x, or 5x multiple can be misleading when segments, stages, or sales cycles differ.
Should New Reps Have A Lower Quota?
The quota or credit schedule should reflect productive capacity during ramp. Some companies use a reduced quota, some use a ramp factor, and some use guaranteed variable pay. Whatever the method, the revenue forecast should not assume full productivity before the rep can reasonably produce it.
How Often Should Quotas Be Reviewed?
Review the assumptions when the market, territory, product, pricing, lead flow, or sales motion changes. A quarterly operating review can catch model drift without turning every short-term variance into a quota reset.
Can A Stretch Quota Still Be Fair?
Yes, if the company labels it as a stretch target and does not present it as the ordinary path to OTE. A pay plan tied to a target that few fully ramped reps can reach needs especially clear disclosure.
Use The Model, Then Save The Assumptions
The useful output is not one quota number.
It is a chain of evidence:
Target
→ wins
→ qualified opportunities
→ closeable opportunity months
→ rep capacity
→ territory supply
→ ramp-adjusted bookings
Save the definitions, source cohorts, dates, and scenario assumptions with the result. That record lets sales, finance, recruiting, and the rep argue about the same model instead of four different versions of reality.
Start with the Sales Quota Feasibility Calculator. If you are hiring into the model, pair it with the Sales Hiring Cost Calculator and the Account Executive Interview Questions.
Sources And Review Note
This guide uses current definitions and planning concepts from Salesforce Help, the Sales Analytics Home Dashboard, Salesforce's explanation of sales velocity, and its current guide to sales win rate. The worked example follows the tested logic in the Account Executive Jobs quota calculator.
The examples are planning models, not universal benchmarks. Replace every input with data from the actual segment, stage, territory, and time cohort.
Written and reviewed by Will Gordon. Last reviewed July 29, 2026.
Account Executive Jobs publishes compensation-forward account executive jobs, practical sales career research, and employer job-posting options.